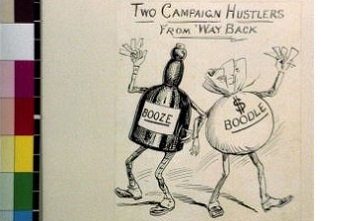
Explore the late 1800s through political cartoons of the time!
Published August 2018
Documentation
This visualization was created by Innovation Intern Jeffrey Shen. Read about Jeffrey's process with his blog post "Exploring Late 1800s Political Cartoons through Interactive Data Visualizations" on The Signal. Source code and some of the most beautiful documentation we've ever seen in his GitHub repo External.
About Jeffrey
Jeffrey Shen worked as an Innovation Intern for the Library of Congress Labs. During his time there, he developed a data visualization of the political cartoons contained in the Library’s Cartoon Drawings collection. Jeffrey is currently a high school senior at Phillips Academy in Massachusetts, and is interested in the intersection of computer science, politics, history, and big data — particularly in the fields of digital journalism, government accountability, and information access.


